Using Behavior Analytics to Detect Changes to your OT Environment

Following up on my previous blog post, I wanted to take a deeper look into how changes can be detected in an operator's OT environment. First things first – let me provide further details on the Purdue model that I refer to in this article:
What does the Purdue Model entail?
The Purdue model was initially conceptualized as a foundational framework for managing data flow in computer-integrated manufacturing (CIM). In CIM, computers play a pivotal role in overseeing and coordinating the entire production process, resulting in enhanced speed and reduced error rates. Subsequently, this model evolved into the benchmark for constructing an industrial control system (ICS) network architecture with a focus on operational technology (OT) security. The primary concept revolves around the stratification of network layers, facilitating a structured data flow between these layers with appropriate zones and conduits in place.
Introduction into OT network zoning and the Purdue Model
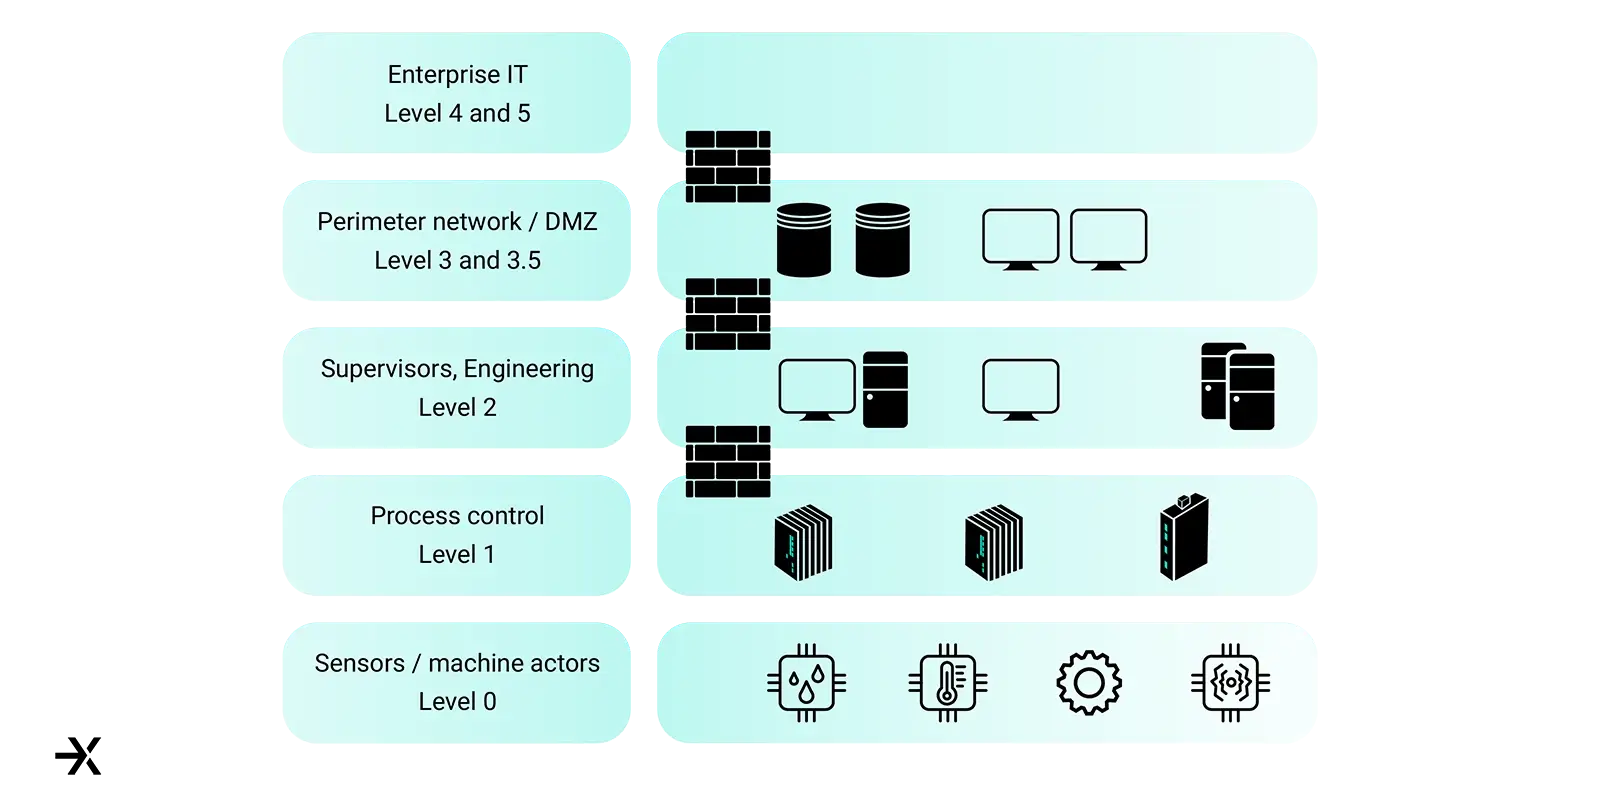
Given a standard Purdue model OT network, different zone boundaries are in scope of traffic analysis. For a typical energy supplier, this would be the control center ranging from, e.g., regular IT traffic (file transfers, backups, Enterprise, and billing interfaces) all the way to IEC-104 communication via TCP/IP. The Purdue model itself defines 6 network zones (and sometimes sub-levels) for a differentiation of the different control levels. Based on these control levels, trust boundaries can be established with zones and conduits based on access control measures and/or firewalling between the different zones. The zones themselves are shown in the picture below where it should be noted that most of the time, level 3.5 defines the DMZ (Demilitarized Zone) between the corporate IT and the OT department.
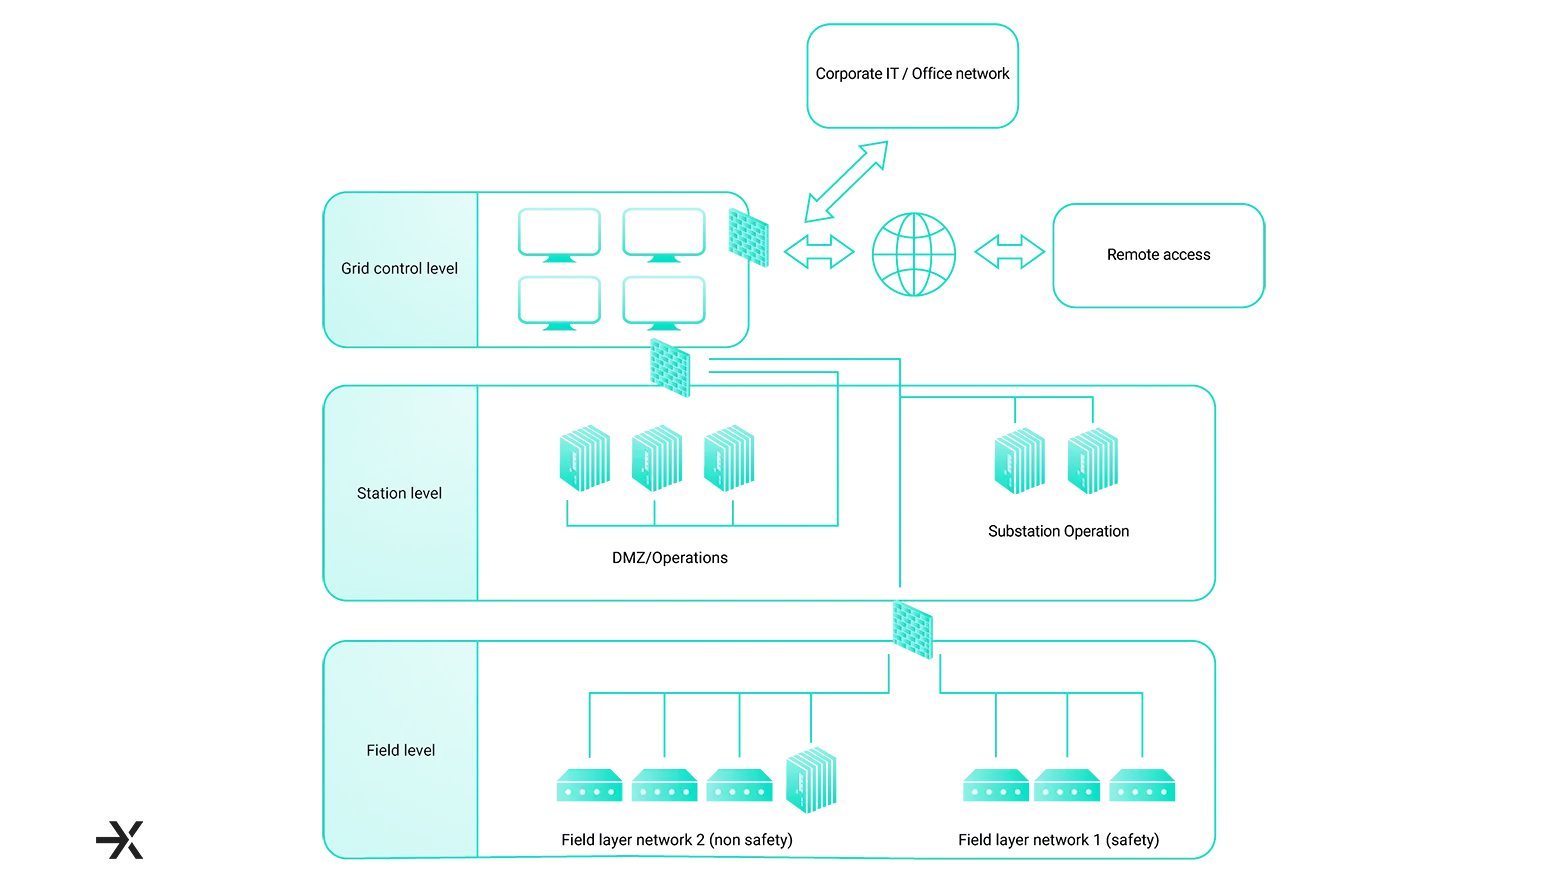
Transferring that zoning knowledge into an actual OT-focused level of energy control, nice and clean zoning might look something like the following image. In this case, you can see that DMZ and Operations are in a separate firewall zone, different from the grid control level.
Depending on the complexity of your whole solution, this might or might not be the case. It is important to note that substation-specific operation is certainly separated but on the same firewall as the grid control and again separated from the field level.
Further down onto Purdue Levels 0 and 1 are the field layer networks separated into a safety and non-safety critical network.
Behavior analytics for OT environments and differences to IT
On general behavior terms, OT communication differs from classical IT communication patterns in the sense that continuous traffic is transmitted for status data of the operational devices (e.g., switches, valves, motors) and only when the operator requests a full log or status update, the amount of traffic sent and received changes significantly. Furthermore, this does not change throughout the day, as OT devices are usually in operation all the time, while their IT client counterparts are only operational during office hours (except maybe for some employees who work in shifts, such as the SOC). These changes can easily be discovered by a Network Detection & Response (NDR) solution working with machine learning (ML) and communication profiles. At the same time, identifying if your administrative behavior has changed (logins from different geolocations, new administrative clients for your e.g., ModbusTCP traffic), puts the whole anomaly detection in a complete picture from a network level.
In addition to the changes in behavior, the NDR solution ExeonTrace can also parse log files from your control center and even your PLCs, should they be transmitted to our NDR solution. By parsing the logs, additional deviations from default behavior can be discovered. This can range from identifying and alerting conflicting commands being sent from previously trusted clients in a short amount of time to critical energy switching logs like a circuit breaker changing internal temperature after use.
It should be noted though, that this is an engineering effort which usually works well when different log entries are available, and the log is well structured. So called brownfield installations, that integrate new technology or systems into an existing infrastructure, sometimes have a certain complexity to it, because of different vendors using different protocols for their PLCs and their SCADA systems. When thinking about sub-system or partly upgrades from e.g., Profibus to Profinet or Modbus RTU to Modbus TCP, different threat vectors for the different protocols as well as different behaviors become eminent.
Due to the lifecycle of OT products with sometimes 20+ years, these parallel installations are much more common than in regular IT landscapes. Therefore, behavioral analytics and challenges with legacy installations will remain common and pure greenfield installations that can start from scratch with a completely new and untouched infrastructure are much more seldom.

Integration of existing security features from your OT network
If you already have a certain set of security features on your OT environment deployed, communication patterns thereof can be easily integrated in your NDR solution. One example of this might be the continuous communication of your EDR solution to its central configuration and orchestration server. Detecting a lack of communication to this server from a previously communicating client might indicate that either the EDR solution has crashed or has been deactivated by a malicious intruder.
A second example might be the use of a central PKI service, which continuously receives requests from clients either through OCSP or certificate enrollments through e.g., PKCS#10. If these requests are logged, deviations from clients communicating with the CA can be similarly detected to different attacks from intruders. This again, is possible via the use of the XLog module and a small engineering effort as soon as the logfiles are available for parsing. A potential flow for detecting this kind of attack can be seen in the picture below.

The implication of detecting these kinds of attacks is bound to the CA actively logging requests from clients for different behaviors and making these log messages known and understood for ExeonTrace.
DPI sensors add another layer of visibility which differs from network metadata and log analysis by triggering upon protocol changes. Still depending on size, they might be lacking the complete overview of the network on all layers as seen in the Purdue model.
Takeaways
I have shown that both communication behavior and log analytics are important means to generate a full picture of your OT environment, even if no DPI sensor is in place. In addition, please be aware that typical brownfield installations show differences in behavior than modern solutions. Overall, the article suggests improving your detection capabilities by leveraging ML to get behavior and time-based changes on your OT network.
What are your thoughts? I would love to hear about your challenges and potential questions.

Author:
Philipp Lachberger
Head Information Security, Head Pre-Sales & Deployment
email:
philipp.lachberger@exeon.com
Share:
Published on:
09.11.2023